
The 2018 NYC Townhouse Report
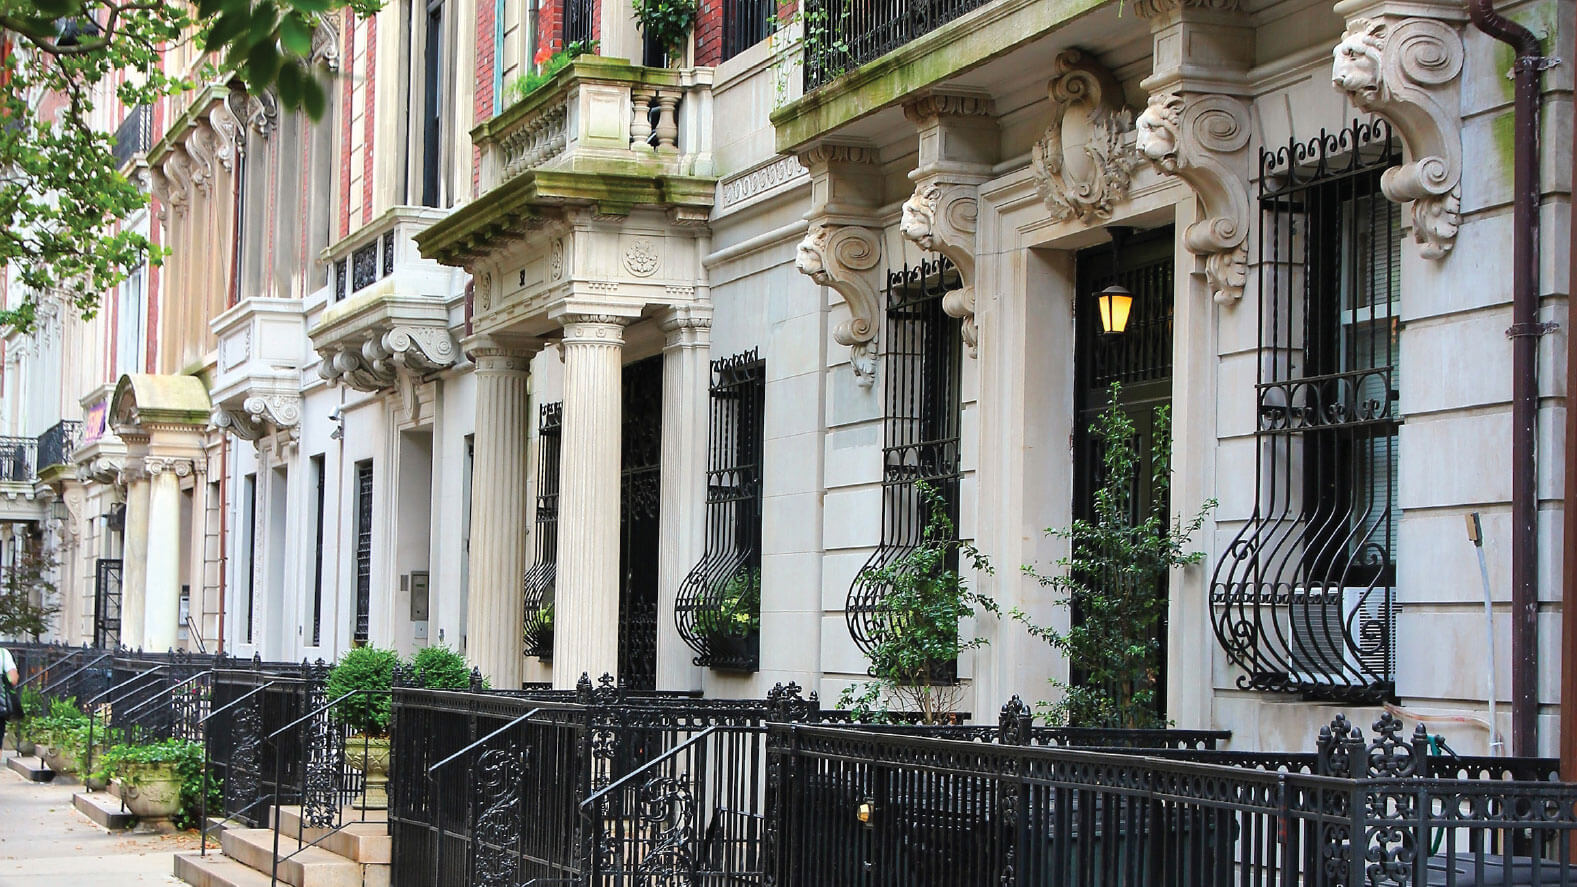
Brooklyn 2018
The Brooklyn townhouse market backed-off from the more rapid pace of sales activity seen over the past few years as some potential buyers took a slight pause while prices climbed even higher. The number of townhouse listings decreased 6% annually so buyers ultimately had fewer options from which
to choose. Williamsburg & Greenpoint took the biggest hit to its townhouse market as both buyers and sellers retreated in response to ongoing transit concerns. Fort Greene, Clinton Hill & Prospect Heights also saw reluctant buyers as the price gap narrowed compared to neighboring Park Slope & Gowanus. The multi-family market in Bedford-Stuyvesant, Crown Heights and Bushwick remained robust although price growth eased versus last year’s gains.
Sales at the low end of the market, particularly under $1M, continued to contract, while those buyers willing to spend over $5M closed on a higher number of deals this year. These two dynamics combined to prop up price statistics, but more modestly compared to last year’s price gains. Median price grew 3% annually while average price increased just 2%.
[embed_cta url=”https://www.ecorcoran.com/uploaded_doc/Brooklyn_Townhouse_Report_2018.pdf”]Download the Brooklyn Report[/embed_cta]
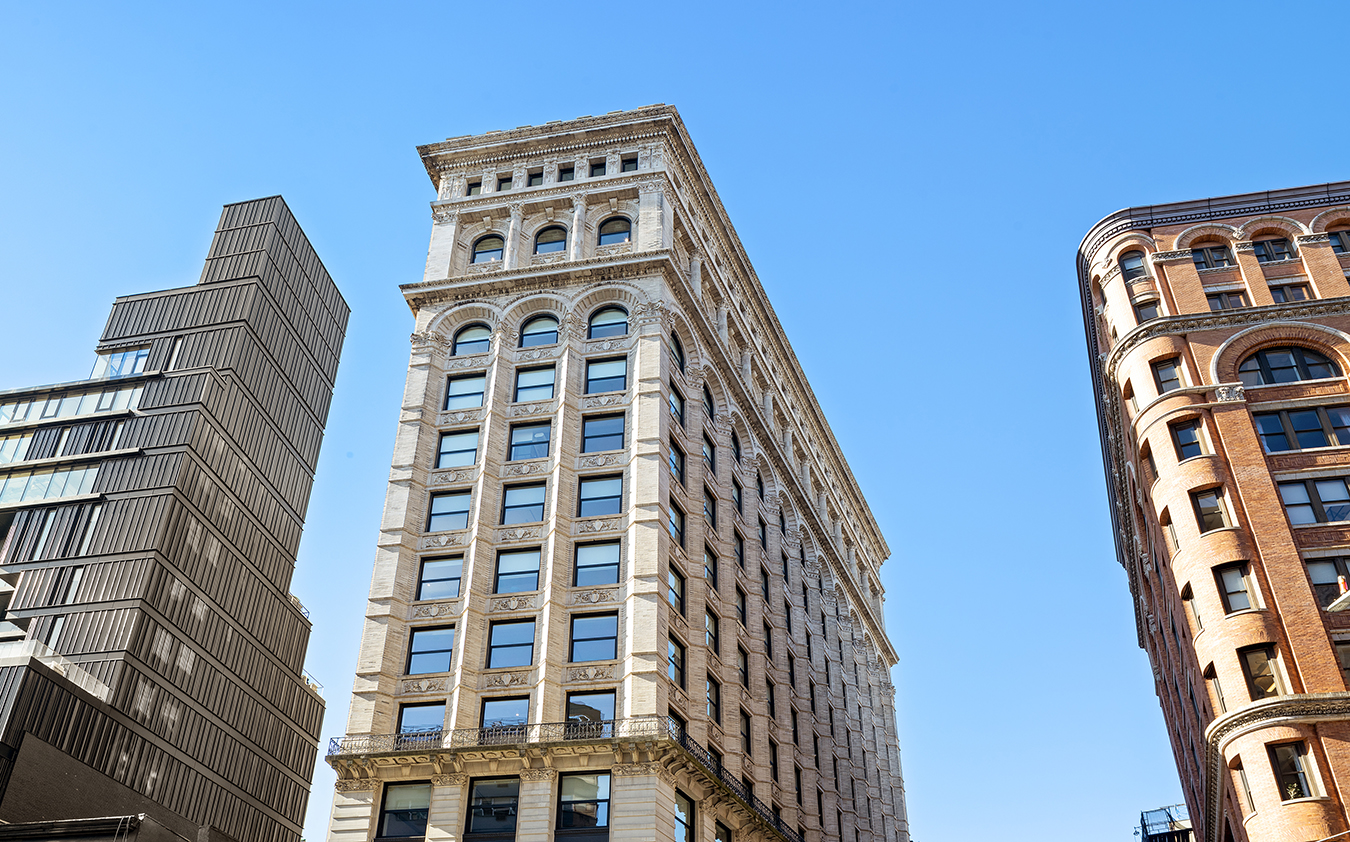
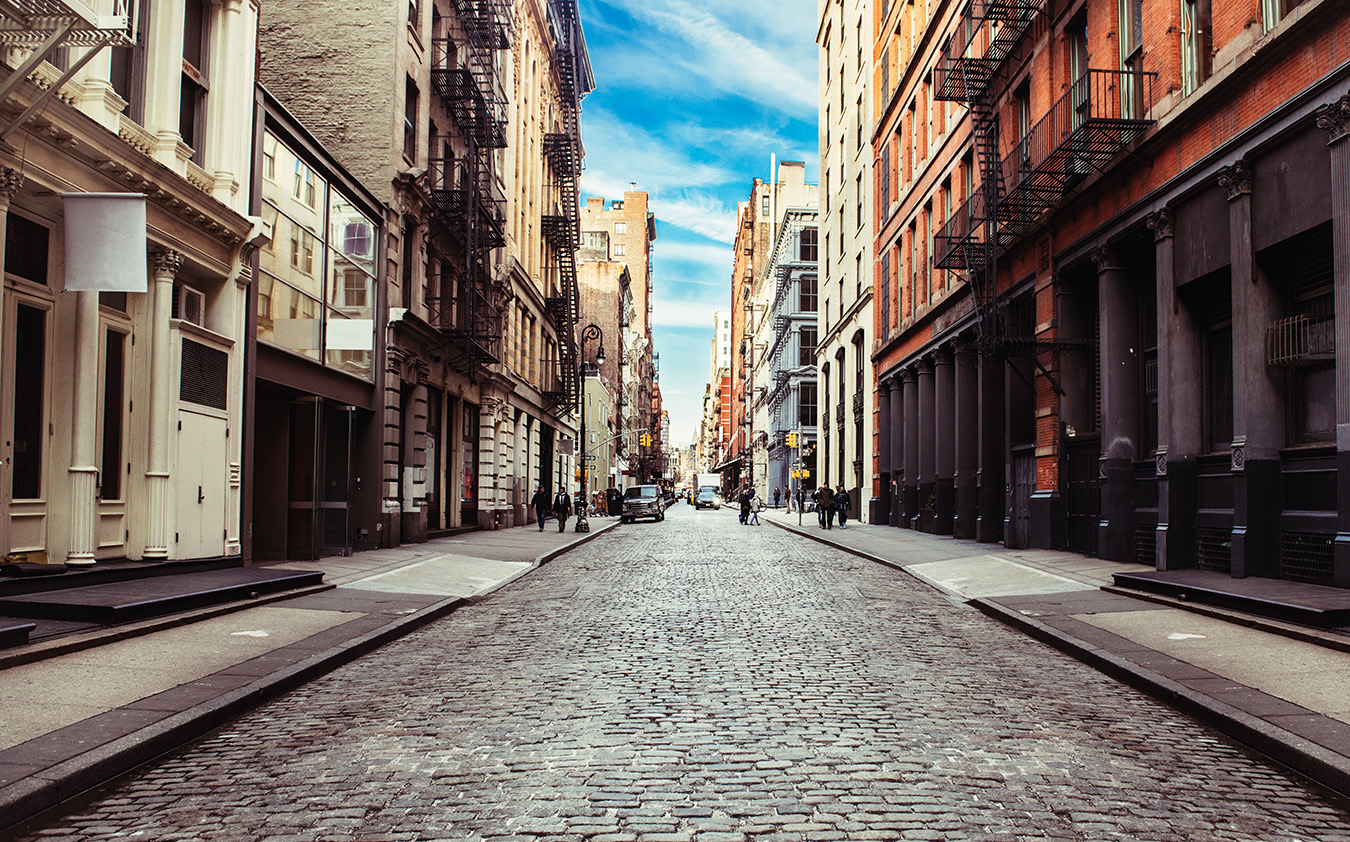
Manhattan 2018
While the overall pace of townhouse sales in Manhattan slowed, activity within different price ranges and regions throughout the borough varied widely.
The low end of the market faced steeper sale declines compared to the high end, and while most regions had slower activity. Downtown had its highest share of sales since 2015. Overall, the number of townhouse listings increased 7% annually as fewer sales pushed up supply. Just 5% fewer transactions occurred over $5M, a lesser annual decline than the overall market at 9%
and a significant driver of the record high price statistics this year. Market share of sales at the low-end, particularly under $3M, reached its lowest point since 2009, and furthermore, the share of sales over $20M reached its second highest point since that year. Median price grew 10% to exceed $5M for the second time in the past decade. Average price also rose 10% year-over-year and average price per square foot was 7% higher.
[embed_cta url=”https://www.ecorcoran.com/uploaded_doc/Manhattan_Townhouse_Report_2018_dupe_1553621280.pdf”]Download the Manhattan Report[/embed_cta]