

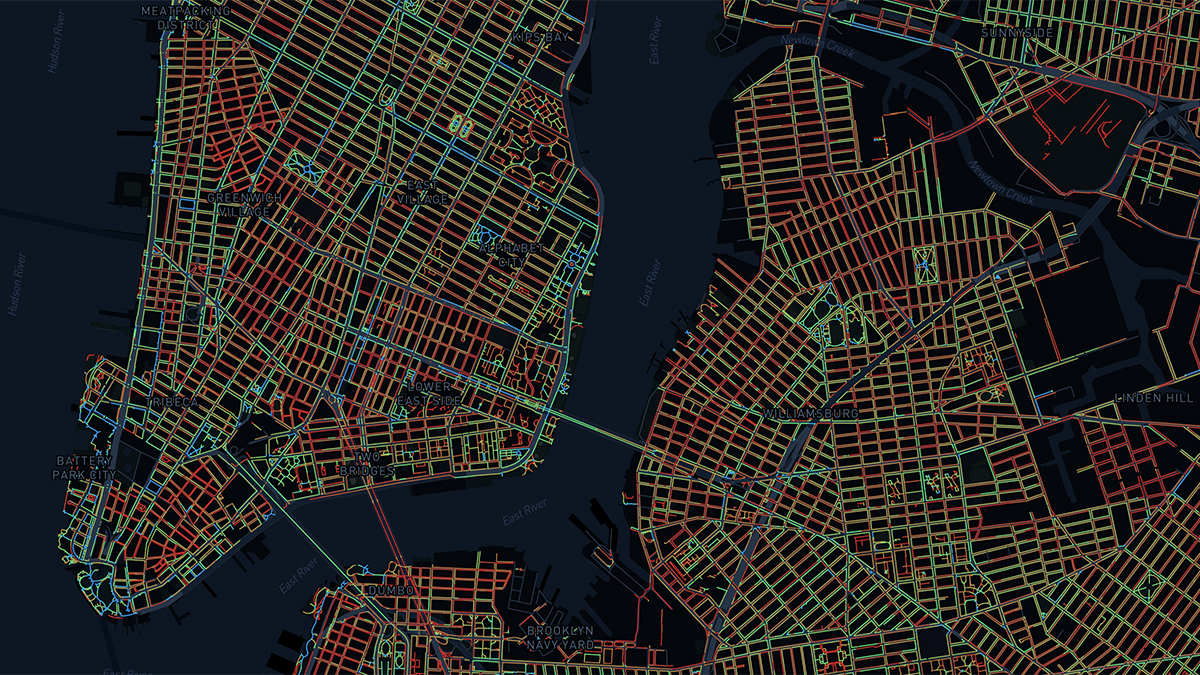
Practice Sidewalk Social Distancing
Staying home is ideal, but sometimes we need to don our masks and run an errand or two (or just run). Unfortunately, maintaining the six-foot rule of social distancing in a city of eight-and-a-half million people is no small feat. So urban planner Meli Harvey created an interactive map that leverages the huge NYC Open Data project to display the widths of sidewalks across the five boroughs, color-coding stretches by their conduciveness to social distancing.
This sharable snippet comes from the April 29 edition of Corcoran’s Home/Office e-newsletter.